
Dashboards & Reporting
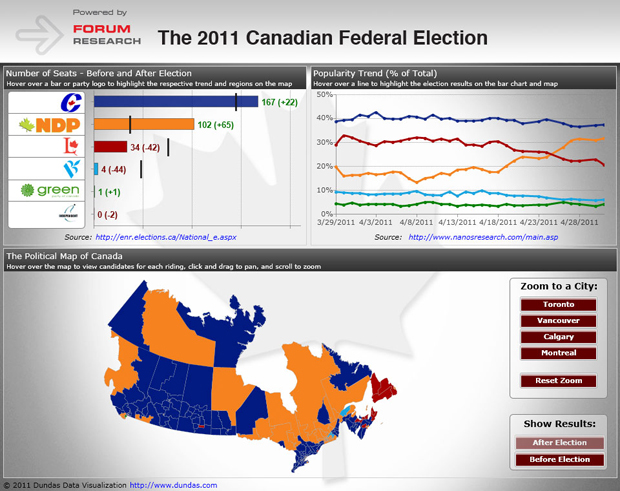
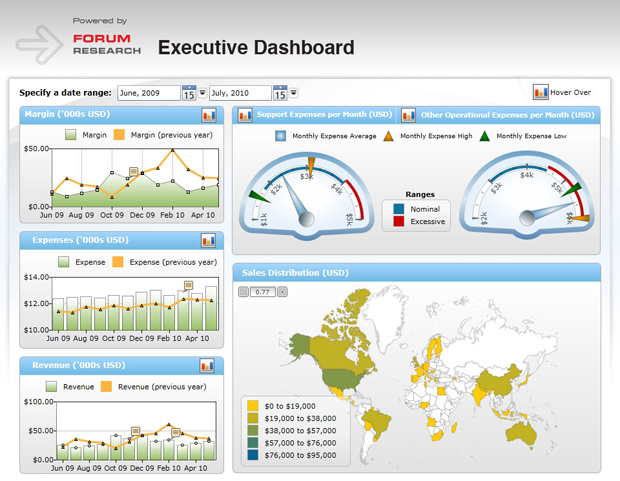
The ability to complete research and analyze Business Intelligence from varying inputs such as customers, the public, employees, and communities is an important element in any research program. The capabilities to format and display the data in a useful format is just as critical. Results need to be displayed as user-friendly visualizations providing accessible data to assist enterprise users in making better business decisions. Access to information also needs to be available in real-time with appropriate levels of user access and security.
Business Intelligence should be displayed and reported in formats that meet the needs of multiple key stakeholder requirements. Key stakeholders can come from different parts of the company with each requiring unique data extracts and specialized views. Dashboards can be customized for a wide variety of key business members as described below:
- Executive
- Manager
- Team leader
- Customer Service Representative
- Business Unit Analyst
- Shared Services
- IT
- HR
- Distribution Partner
Reports can also be outputted in different formats to meet customer needs. Standard MS Word documents can be produced as required (daily, weekly, monthly, quarterly, or annually). Typically these reports are customized to meet our customers' requirements and can include descriptive graphs and charts to highlight our expert research data.
Reports can also be generated in a more presentation friendly PowerPoint format so that relevant business points and objectives can be shared and discussed in a group setting.
Consulting
The Forum consulting team takes a holistic customer viewpoint in developing the roadmap you need to move your enterprise forward.
